Data Analytics Training
Unlock data potential with hands-on analytics projects using real-world datasets
- Master essential tools: Excel, SQL, Python, Power BI, Tableau, and Statistics
- Live online and offline interactive sessions from top industry professionals
- Guaranteed placement support through our career advancement services
- Understand data wrangling, visualization, reporting, and business intelligence

World-Class Instructors

1:1 with Industry Mentors

55% Avg. Salary Hike

Interview Preparation
World-Class Instructors
1:1 with Industry Mentors
55% Avg. Salary Hike
Interview Preparation
What You’ll Learn
Accelerate your career in data with our Data Analytics Training at TechPragna in Bangalore. This comprehensive course equips you with the tools and techniques to collect, analyze, and visualize data for actionable business insights—perfect for both beginners and working professionals.
Data Analytics Training – Key Features
- Master essential tools: Excel, SQL, Python, Power BI, Tableau, and Statistics
- Live online and offline interactive sessions from top industry professionals
- Guaranteed placement support through our career advancement services
- Master essential tools: Excel, SQL, Python, Power BI, Tableau, and Statistics
- Live online and offline interactive sessions from top industry professionals
- Guaranteed placement support through our career advancement services
Request more information
Data Analytics Course Curriculum
Data Analytics Course Curriculum
Introduction to Data Analytics
What is Data Analytics?
Importance of Data-Driven Decision Making
Types of Data Analytics: Descriptive, Diagnostic, Predictive, Prescriptive
Key Roles in Data Analytics
Data Analytics Lifecycle
Real-World Applications of Data Analytics
Career Scope and Opportunities
Essential Tools and Technologies Overview
Understanding Data and Data Types
Structured vs Unstructured Data
Quantitative vs Qualitative Data
Data Sources in Modern Businesses
Primary and Secondary Data Collection Methods
Importance of Data Cleaning
Data Privacy and Security Fundamentals
Identifying Biases in Data
Best Practices in Data Collection and Storage
Data Collection Techniques
Structured vs Unstructured Data
Quantitative vs Qualitative Data
Data Sources in Modern Businesses
Primary and Secondary Data Collection Methods
Importance of Data Cleaning
Data Privacy and Security Fundamentals
Identifying Biases in Data
Best Practices in Data Collection and Storage
Data Cleaning and Preparation
- Handling Missing Data Techniques
- Removing Duplicates and Errors
- Data Transformation and Normalization
- Data Encoding Methods (Label Encoding, One-Hot Encoding)
- Outlier Detection and Treatment
- Data Scaling Techniques (MinMax, StandardScaler)
- Data Integration from Multiple Sources
- Preparing Data for Analysis and Modeling
Data Visualization Essentials
- Importance of Data Visualization
- Introduction to Visualization Tools (Tableau, Power BI, Python)
- Choosing the Right Chart Types
- Designing Effective Dashboards
- Best Practices for Storytelling with Data
- Interactive vs Static Visualizations
- Avoiding Misleading Visuals
- Hands-on Data Visualization Projects
Statistical Fundamentals for Data Analytics
- Descriptive Statistics Overview
- Mean, Median, Mode, Variance, Standard Deviation
- Probability Basics
- Inferential Statistics Introduction
- Hypothesis Testing Concepts
- Correlation vs Causation
- Linear and Logistic Regression Basics
- Using Statistics in Business Analytics
Excel for Data Analytics
Advanced Excel Functions (VLOOKUP, INDEX, MATCH)
Pivot Tables and Pivot Charts
Data Cleaning in Excel
Conditional Formatting Techniques
Dashboard Creation in Excel
Excel Macros and Automation
Data Analysis ToolPak Usage
Real-Life Data Projects with Excel
SQL for Data Analytics
SQL Basics: SELECT, WHERE, GROUP BY
Data Filtering and Sorting
JOINs (INNER, LEFT, RIGHT, FULL)
Subqueries and Nested Queries
Window Functions and Ranking
Data Aggregation Techniques
Data Manipulation (INSERT, UPDATE, DELETE)
Hands-on SQL Practice with Real Data
Python for Data Analytics
Introduction to Python Programming
Data Structures: Lists, Tuples, Dictionaries
Data Manipulation with Pandas
Data Visualization with Matplotlib & Seaborn
Exploratory Data Analysis (EDA)
Introduction to NumPy for Data Calculations
Data Cleaning with Python
Project: Analyzing Business Data using Python
Introduction to Machine Learning
Basics of Machine Learning
Supervised vs Unsupervised Learning
Regression Techniques
Classification Algorithms
Clustering Fundamentals
Model Evaluation Metrics (Accuracy, F1 Score)
Overfitting and Underfitting Concepts
Practical Mini-Projects using ML
Power BI for Business Analytics
Power BI Interface and Navigation
Connecting Data Sources in Power BI
Data Transformation with Power Query
Building Interactive Reports
DAX Basics for Calculations
Sharing and Publishing Reports
Custom Visuals and Marketplace
Live Business Dashboard Project
Capstone Project and Career Preparation
Industry-Specific Data Analytics Project
Applying End-to-End Data Analytics Lifecycle
Resume Building for Data Analyst Roles
Crafting an Impressive Data Portfolio
Mock Interviews and Q&A Sessions
LinkedIn Optimization for Data Analytics
Interview Preparation and Case Studies
Final Project Presentation and Feedback
Master In-Demand Skills with Practical, Industry-Based Learning
Master In-Demand Skills with Practical, Industry-Based Learning
What Role Does a Data Analytics Professional Play?
Data Analyst
Collects, processes, and interprets data to help organizations make informed business decisions through reports and dashboards
Business Analyst
Bridges the gap between business goals and data insights by analyzing business processes and recommending data-driven improvements.
Data Scientist
Uses advanced statistical methods, machine learning, and predictive modeling to forecast trends and solve complex business problems.
Data Engineer
Designs and manages data pipelines, ensuring data is collected, cleaned, and made accessible for analysis and reporting.
Data Visualization Specialist
Focuses on transforming raw data into compelling visual stories using tools like Power BI, Tableau, or Python visualization libraries.
Analytics Consultant
Provides expert advice to organizations on how to use data analytics to improve performance, optimize strategies, and achieve business objectives
Skills Covered
Data Cleaning
Statistical Analysis
Advanced Excel
SQL Querying
Data Visualization
Python Programming
Exploratory Analysis
Machine Learning
Data Storytelling
Business Intelligence
12+ Data Analytics Tools Covered
Data Analyst
Collects, processes, and interprets data to help organizations make informed business decisions through reports and dashboards
Business Analyst
Bridges the gap between business goals and data insights by analyzing business processes and recommending data-driven improvements.
Data Scientist
Uses advanced statistical methods, machine learning, and predictive modeling to forecast trends and solve complex business problems.
Data Engineer
Designs and manages data pipelines, ensuring data is collected, cleaned, and made accessible for analysis and reporting.
Data Visualization Specialist
Focuses on transforming raw data into compelling visual stories using tools like Power BI, Tableau, or Python visualization libraries.
Analytics Consultant
Provides expert advice to organizations on how to use data analytics to improve performance, optimize strategies, and achieve business objectives
Skills Covered
Data Cleaning
Statistical Analysis
Advanced Excel
SQL Querying
Data Visualization
Python Programming
Exploratory Analysis
Machine Learning
Data Storytelling
Business Intelligence
12+ Data Science Tools Covered
Career Services


Placement Assistance

Personalized Guidance

Mock Interview Preparation

One-on-One Mentoring session

Career Oriented Seesions

Resume & LinkedIn Profile Building
Placement Assistance
Personalized Guidance
Mock Interview Preparation
One-on-One Mentoring session
Career Oriented Seesions
Resume & LinkedIn Profile Building
How our program works
Enhance Your Skills to Transform Your Career Path
- Gain official proof of your expertise from a trusted institution, increasing your value in the eyes of employers and clients.
- Stand out in competitive job markets and unlock better job roles, promotions, or freelance opportunities.
- Certifications ensure your skills are aligned with current industry standards, making you job-ready from day one.
- Completing a certified course strengthens your belief in your capabilities and readiness to tackle real-world challenges.
- Join a professional community, gain access to hiring managers, and receive support from placement partners and mentors.
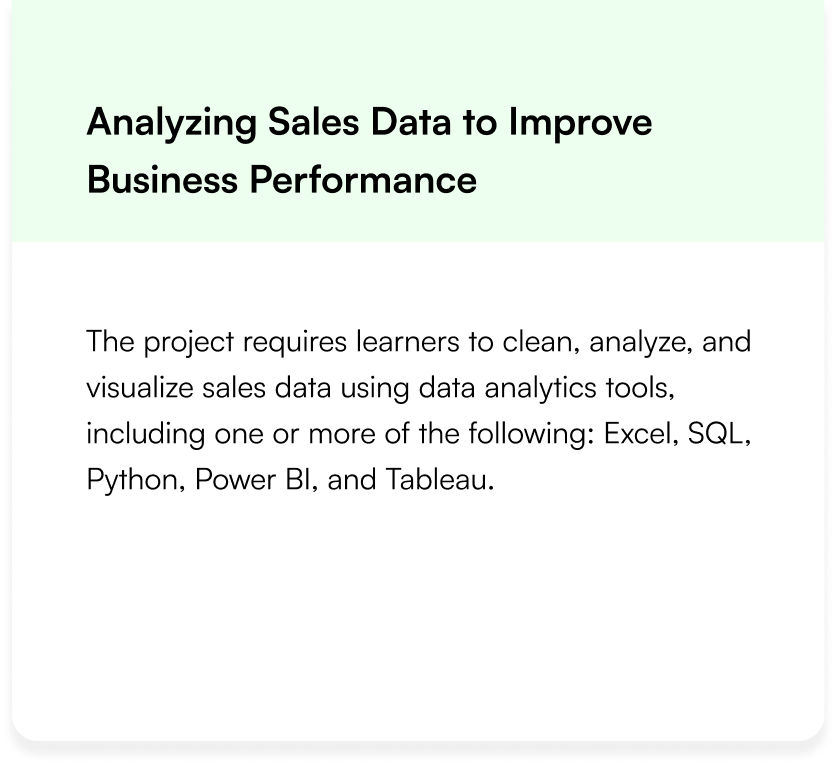
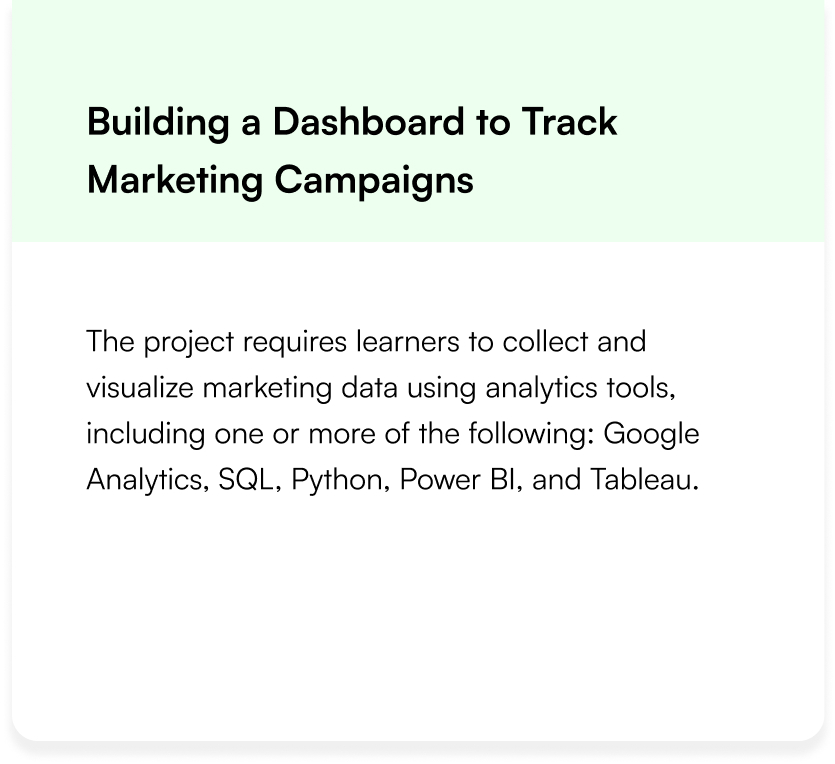
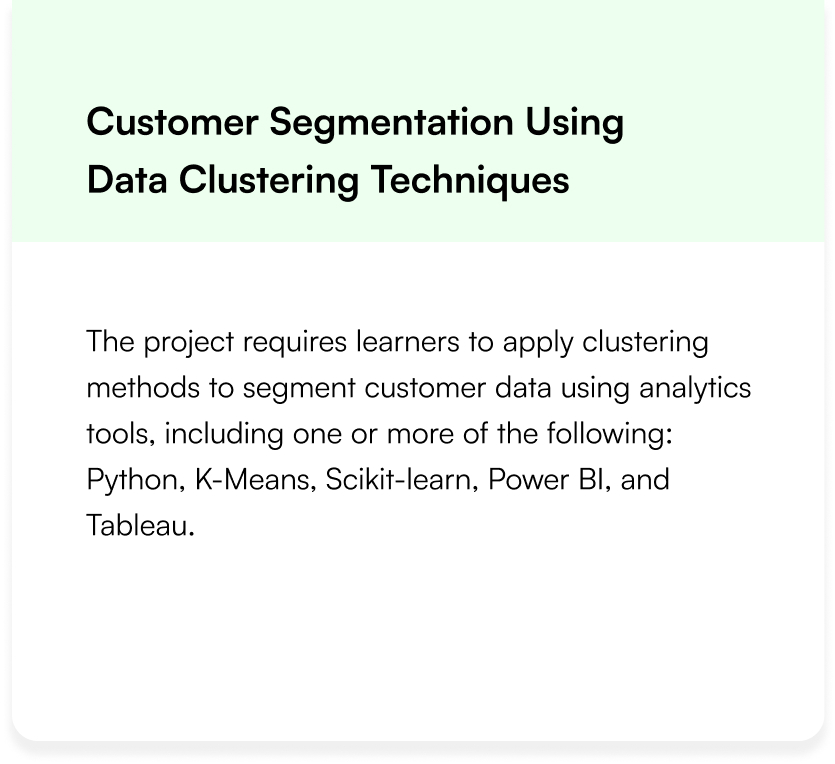
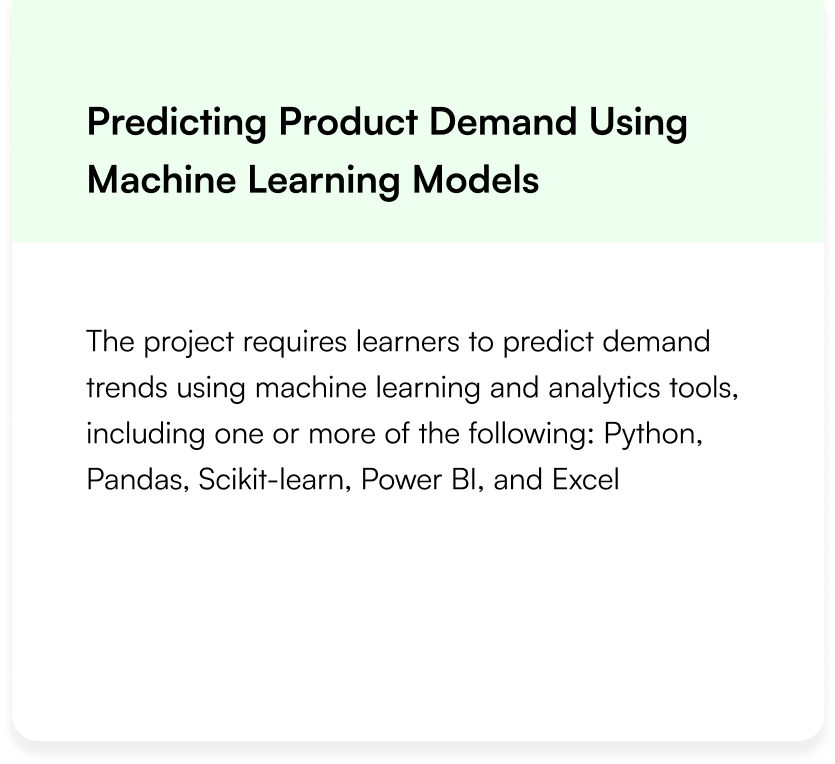
Data Analytics Projects Covered
Data Analytics Projects Covered
Land Your Dream Job Our Alumni
Land Your Dream Job Our Alumni
Data Analytics Training FAQs
Do I need coding experience to start?
No prior coding is necessary; most courses start from basics and gradually introduce tools like SQL or Python.
Is Data Analytics suitable for non-technical backgrounds?
Yes, the course is designed for beginners from any educational or professional background.
Will I get a certificate after completion?
Yes, the course is designed for beginners from any educational or professional background.
What is the average salary after completing the course?
Entry-level salaries range from ₹4–7 LPA in India, depending on location and company.
Do you provide placement assistance?
Yes, many programs offer placement support, interview preparation, and resume building services
Is this course available online or offline?
Tech Pragna are offered in both online and offline
Which industries hire Data Analysts?
Industries like finance, healthcare, e-commerce, marketing, and IT actively hire data analysts.
What Our Learners Have To Say
What Our Learners Have To Say


Explore the Latest Trending Courses
Explore the Latest Trending Courses

Software Testing
- Online/Offline
- 6 Months
- Professional Level Certification
- Projects and Case Study
Data Science
- Online/Offline
- 6 Months
- Professional Level Certification
- Projects and Case Study

Network Engineering
- Online/Offline
- 6 Months
- Professional Level Certification
- Projects and Case Study

Cyber Security
- Online/Offline
- 6 Months
- Professional Level Certification
- Projects and Case Study
Software Testing
- Online/Offline
- 6 Months
- Professional Level Certification
- Projects and Case Study
Data Science
- Online/Offline
- 6 Months
- Professional Level Certification
- Projects and Case Study
Network Engineering
- Online/Offline
- 6 Months
- Professional Level Certification
- Projects and Case Study
Cyber Security
- Online/Offline
- 6 Months
- Professional Level Certification
- Projects and Case Study